Ballots already cast, from each state election office’s own daily files. Updated every morning. Every number links to the file it came from.
Party is the voter’s registration, not their vote. Ballots are secret: these numbers say who has voted, never how.
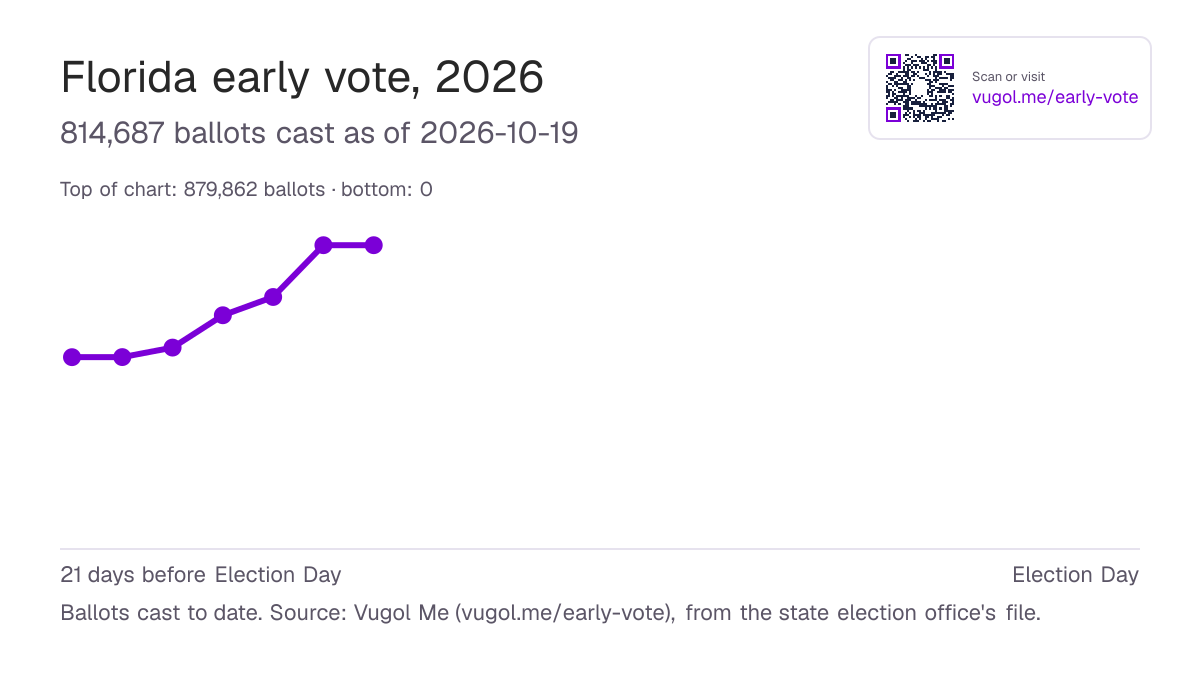
| Mail (civilian absentee) | 814,687 | 100.0% |
|---|
| County | Ballots | Dem | Rep | Unaff. |
|---|---|---|---|---|
| Miami-dade | 77,412 | 42.0% | 31.5% | 24.6% |
| Palm beach | 68,592 | 53.2% | 25.7% | 18.4% |
| Pinellas | 61,256 | 39.4% | 38.5% | 19.6% |
| Lee | 52,348 | 31.4% | 46.2% | 19.9% |
| Broward | 46,168 | 57.3% | 21.7% | 19.1% |
| Hillsborough | 45,113 | 43.8% | 34.4% | 19.4% |
| Orange | 42,901 | 49.5% | 28.0% | 20.3% |
| Sarasota | 36,658 | 43.9% | 36.2% | 17.3% |
| Volusia | 27,300 | 38.8% | 38.6% | 19.5% |
| Brevard | 27,100 | 38.7% | 39.8% | 18.6% |
| Polk | 25,691 | 41.9% | 40.2% | 15.7% |
| Collier | 23,598 | 27.6% | 51.6% | 18.4% |
| Pasco | 23,584 | 41.3% | 36.1% | 19.7% |
| Manatee | 21,618 | 38.1% | 41.8% | 17.9% |
| Charlotte | 15,168 | 33.2% | 44.9% | 18.2% |
| Seminole | 14,677 | 42.5% | 35.2% | 19.6% |
| Marion | 14,564 | 43.6% | 38.8% | 15.0% |
| Lake | 14,166 | 41.1% | 37.5% | 19.2% |
| St. lucie | 13,647 | 44.8% | 34.2% | 18.2% |
| Duval | 12,681 | 49.1% | 35.0% | 13.7% |
| Osceola | 12,161 | 47.2% | 27.2% | 23.2% |
| Sumter | 11,160 | 34.5% | 45.6% | 17.3% |
| Indian river | 10,845 | 36.6% | 43.1% | 17.0% |
| Leon | 10,438 | 59.8% | 25.4% | 13.1% |
| Hernando | 10,369 | 40.3% | 39.8% | 17.7% |
| Citrus | 10,123 | 31.4% | 48.3% | 17.2% |
| St. johns | 9,660 | 41.7% | 39.5% | 16.5% |
| Alachua | 8,979 | 59.1% | 23.1% | 15.6% |
| Martin | 8,394 | 36.9% | 44.9% | 15.1% |
| Flagler | 7,614 | 41.1% | 39.6% | 16.9% |
| Escambia | 6,939 | 41.2% | 42.6% | 14.1% |
| Clay | 6,022 | 32.0% | 49.3% | 16.4% |
| Bay | 4,197 | 31.0% | 52.2% | 14.6% |
| Monroe | 4,110 | 41.9% | 42.6% | 13.6% |
| Nassau | 4,001 | 32.9% | 46.7% | 17.4% |
| Highlands | 3,378 | 41.1% | 40.1% | 15.8% |
| Okaloosa | 3,025 | 33.1% | 47.9% | 16.8% |
| Santa rosa | 1,800 | 33.7% | 49.8% | 14.1% |
| Columbia | 1,712 | 35.9% | 52.6% | 9.5% |
| Levy | 1,648 | 31.0% | 56.1% | 10.3% |
| Putnam | 1,498 | 39.6% | 47.0% | 11.6% |
| Walton | 1,374 | 28.1% | 58.0% | 11.3% |
| Gadsden | 1,110 | 77.3% | 16.5% | 5.6% |
| Suwannee | 953 | 31.8% | 57.6% | 8.4% |
| Okeechobee | 849 | 36.7% | 51.1% | 9.9% |
| Jackson | 789 | 45.8% | 47.5% | 5.7% |
| Wakulla | 746 | 38.6% | 48.7% | 10.3% |
| Desoto | 606 | 39.8% | 43.1% | 15.5% |
| Hendry | 504 | 42.5% | 44.4% | 10.7% |
| Gilchrist | 491 | 27.1% | 63.3% | 7.7% |
| Dixie | 460 | 21.7% | 66.5% | 9.8% |
| Washington | 414 | 29.0% | 62.8% | 5.3% |
| Bradford | 412 | 34.5% | 55.1% | 8.5% |
| Gulf | 398 | 30.7% | 55.8% | 9.0% |
| Franklin | 379 | 41.7% | 41.7% | 12.4% |
| Baker | 376 | 20.5% | 71.8% | 6.9% |
| Jefferson | 355 | 63.4% | 26.8% | 8.2% |
| Glades | 330 | 33.0% | 54.8% | 10.9% |
| Madison | 324 | 54.0% | 36.1% | 9.3% |
| Holmes | 275 | 25.1% | 67.6% | 5.8% |
| Hamilton | 265 | 40.8% | 51.3% | 6.0% |
| Taylor | 263 | 41.8% | 50.6% | 6.5% |
| Calhoun | 229 | 36.2% | 60.3% | 3.5% |
| Hardee | 199 | 37.2% | 51.3% | 10.6% |
| Union | 116 | 30.2% | 62.1% | 5.2% |
| Lafayette | 83 | 21.7% | 77.1% | 0.0% |
| Liberty | 72 | 47.2% | 52.8% | 0.0% |
Download the pace chart (PNG) � free with credit, terms
Source: Florida election office, official count file, retrieved 2026-10-19 11:06 UTC. SHA-256 ee6b8a611c777c006b3eed68a2515441f39558caf517633a85c7ee575da49848. Public record; parsed by fixed code. Only totals are kept, never voter-level records.
Party is the voter’s registration, not their vote. Ballots are secret: these numbers say who has voted, never how.
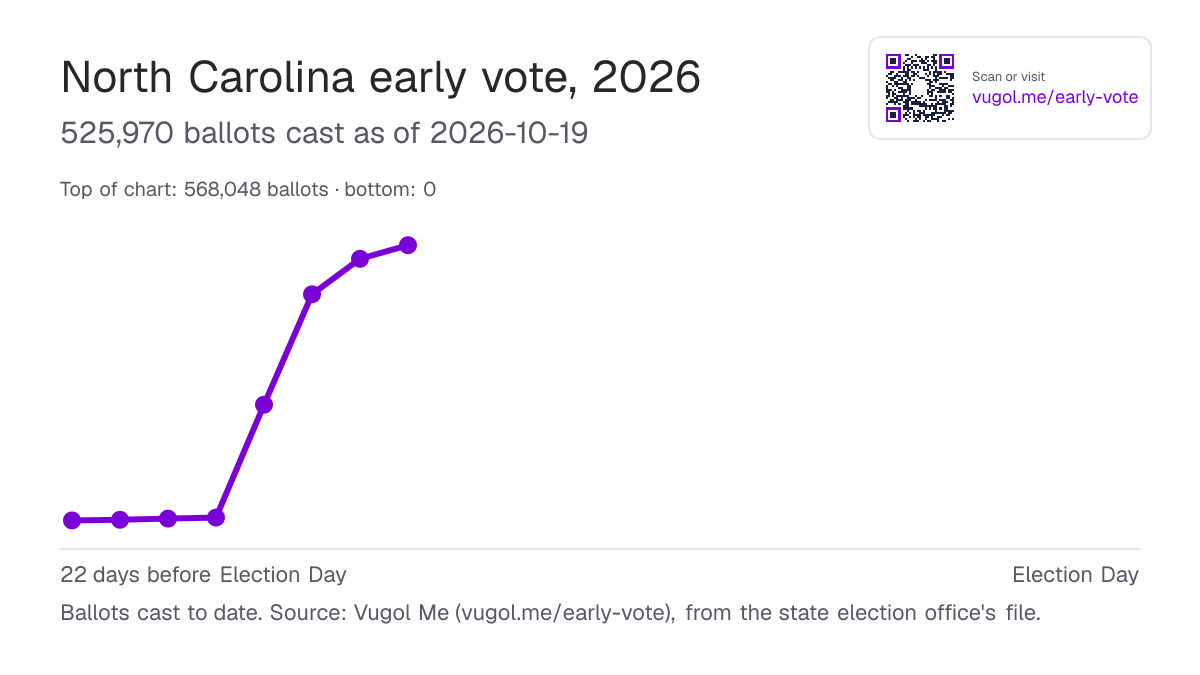
| Mail (civilian absentee) | 33,608 | 6.4% |
|---|---|---|
| In person, early | 485,531 | 92.3% |
| Military and overseas | 6,831 | 1.3% |
| County | Ballots | Dem | Rep | Unaff. |
|---|---|---|---|---|
| Wake | 73,586 | 46.5% | 11.9% | 41.3% |
| Mecklenburg | 58,714 | 52.4% | 11.2% | 36.3% |
| Durham | 26,347 | 62.7% | 4.6% | 32.5% |
| Guilford | 22,477 | 52.8% | 16.6% | 30.4% |
| Buncombe | 20,190 | 49.2% | 10.3% | 40.3% |
| Forsyth | 18,038 | 50.4% | 17.4% | 31.9% |
| Orange | 14,115 | 58.4% | 4.9% | 36.6% |
| Cumberland | 12,959 | 58.3% | 15.5% | 26.0% |
| Brunswick | 11,889 | 32.5% | 28.4% | 38.9% |
| Union | 11,400 | 33.0% | 27.8% | 38.9% |
| New hanover | 10,991 | 41.0% | 22.5% | 36.3% |
| Gaston | 10,046 | 37.2% | 31.5% | 31.2% |
| Cabarrus | 9,795 | 39.0% | 22.8% | 38.0% |
| Henderson | 8,965 | 30.9% | 24.4% | 44.5% |
| Johnston | 8,119 | 41.9% | 24.6% | 33.3% |
| Pitt | 8,112 | 56.4% | 16.7% | 26.7% |
| Catawba | 7,955 | 28.0% | 32.6% | 39.0% |
| Chatham | 7,339 | 48.0% | 12.1% | 39.7% |
| Alamance | 7,333 | 43.2% | 25.6% | 30.9% |
| Iredell | 7,032 | 31.6% | 31.2% | 36.9% |
| Davidson | 6,173 | 29.2% | 39.9% | 30.7% |
| Nash | 6,071 | 52.4% | 20.8% | 26.7% |
| Harnett | 6,015 | 40.7% | 28.1% | 30.7% |
| Onslow | 5,931 | 34.1% | 30.1% | 35.5% |
| Moore | 5,581 | 30.7% | 32.2% | 36.9% |
| Wayne | 4,698 | 50.1% | 27.3% | 22.5% |
| Craven | 4,502 | 39.6% | 30.8% | 29.4% |
| Franklin | 4,276 | 48.4% | 21.2% | 30.0% |
| Carteret | 4,239 | 23.0% | 40.5% | 36.3% |
| Lincoln | 4,156 | 30.8% | 35.6% | 33.5% |
| Rockingham | 4,073 | 37.4% | 33.1% | 29.3% |
| Rowan | 3,973 | 33.1% | 33.9% | 32.7% |
| Randolph | 3,894 | 24.7% | 45.3% | 30.0% |
| Cleveland | 3,883 | 43.0% | 29.1% | 27.8% |
| Wilson | 3,736 | 60.5% | 15.3% | 24.0% |
| Haywood | 3,688 | 38.3% | 24.5% | 36.9% |
| Granville | 3,620 | 50.1% | 20.2% | 29.5% |
| Burke | 3,363 | 34.3% | 29.5% | 35.9% |
| Robeson | 3,039 | 58.1% | 15.6% | 26.0% |
| Watauga | 2,982 | 40.9% | 15.4% | 43.4% |
| Lee | 2,854 | 45.4% | 21.6% | 32.9% |
| Caldwell | 2,840 | 28.6% | 37.6% | 33.5% |
| Lenoir | 2,771 | 60.5% | 18.3% | 21.1% |
| Pender | 2,640 | 32.6% | 31.5% | 35.6% |
| Surry | 2,616 | 31.5% | 39.9% | 28.6% |
| Edgecombe | 2,515 | 78.4% | 9.7% | 11.7% |
| Transylvania | 2,480 | 35.6% | 19.1% | 45.2% |
| Hoke | 2,353 | 60.5% | 11.0% | 28.4% |
| Dare | 2,147 | 30.4% | 24.6% | 44.9% |
| Stanly | 2,137 | 27.8% | 39.2% | 32.8% |
| Person | 2,135 | 48.7% | 20.1% | 30.9% |
| Rutherford | 2,130 | 27.7% | 36.6% | 35.7% |
| Mcdowell | 2,049 | 26.6% | 38.2% | 35.0% |
| Beaufort | 2,041 | 38.9% | 28.9% | 32.0% |
| Vance | 2,041 | 69.6% | 12.3% | 17.9% |
| Macon | 1,985 | 29.2% | 31.0% | 39.5% |
| Halifax | 1,980 | 72.9% | 6.3% | 20.6% |
| Jackson | 1,977 | 44.3% | 17.3% | 38.2% |
| Pasquotank | 1,949 | 51.1% | 19.3% | 29.5% |
| Davie | 1,829 | 24.7% | 38.6% | 36.5% |
| Wilkes | 1,763 | 27.4% | 44.9% | 27.7% |
| Polk | 1,742 | 33.5% | 24.6% | 41.7% |
| Stokes | 1,698 | 26.8% | 44.9% | 28.2% |
| Richmond | 1,505 | 49.0% | 22.9% | 27.8% |
| Sampson | 1,490 | 53.6% | 28.3% | 17.9% |
| Duplin | 1,486 | 41.1% | 27.3% | 31.4% |
| Columbus | 1,452 | 48.1% | 25.0% | 26.7% |
| Scotland | 1,430 | 58.1% | 16.4% | 25.4% |
| Bladen | 1,351 | 52.0% | 19.6% | 28.3% |
| Alexander | 1,317 | 24.6% | 43.1% | 32.0% |
| Ashe | 1,274 | 29.8% | 31.9% | 38.0% |
| Madison | 1,222 | 39.4% | 23.1% | 37.4% |
| Cherokee | 1,162 | 20.5% | 44.1% | 35.3% |
| Yadkin | 1,142 | 19.2% | 50.1% | 30.7% |
| Yancey | 1,065 | 39.4% | 23.4% | 37.1% |
| Martin | 992 | 66.1% | 10.6% | 23.2% |
| Warren | 947 | 70.0% | 12.0% | 17.8% |
| Hertford | 886 | 79.3% | 7.9% | 12.6% |
| Montgomery | 878 | 41.8% | 28.4% | 29.7% |
| Greene | 864 | 66.4% | 12.6% | 20.9% |
| Anson | 846 | 63.7% | 14.4% | 21.7% |
| Chowan | 835 | 42.3% | 29.3% | 28.0% |
| Pamlico | 813 | 38.9% | 28.5% | 32.5% |
| Currituck | 810 | 22.3% | 35.1% | 42.2% |
| Northampton | 797 | 76.9% | 5.9% | 17.1% |
| Caswell | 795 | 50.1% | 20.1% | 29.6% |
| Bertie | 718 | 76.0% | 6.0% | 17.8% |
| Mitchell | 713 | 19.6% | 43.5% | 36.6% |
| Clay | 641 | 27.9% | 35.6% | 36.2% |
| Washington | 626 | 71.4% | 9.9% | 18.7% |
| Perquimans | 610 | 30.8% | 36.1% | 32.8% |
| Alleghany | 577 | 30.5% | 36.4% | 33.1% |
| Avery | 518 | 23.0% | 38.4% | 38.4% |
| Swain | 497 | 41.4% | 24.1% | 34.0% |
| Camden | 400 | 26.5% | 27.5% | 46.0% |
| Jones | 388 | 45.1% | 27.3% | 27.3% |
| Gates | 379 | 54.1% | 21.9% | 24.0% |
| Graham | 373 | 28.7% | 41.8% | 29.0% |
| Hyde | 103 | 40.8% | 25.2% | 34.0% |
| Tyrrell | 101 | 41.6% | 19.8% | 38.6% |
Download the pace chart (PNG) � free with credit, terms
Source: North Carolina election office, official count file, retrieved 2026-10-19 11:06 UTC. SHA-256 f4921d4e3347048769660442be494b6ede348b50c1076f72e7de9b0fe9a09139. Public record; parsed by fixed code. Only totals are kept, never voter-level records.
Party is the voter’s registration, not their vote. Ballots are secret: these numbers say who has voted, never how.
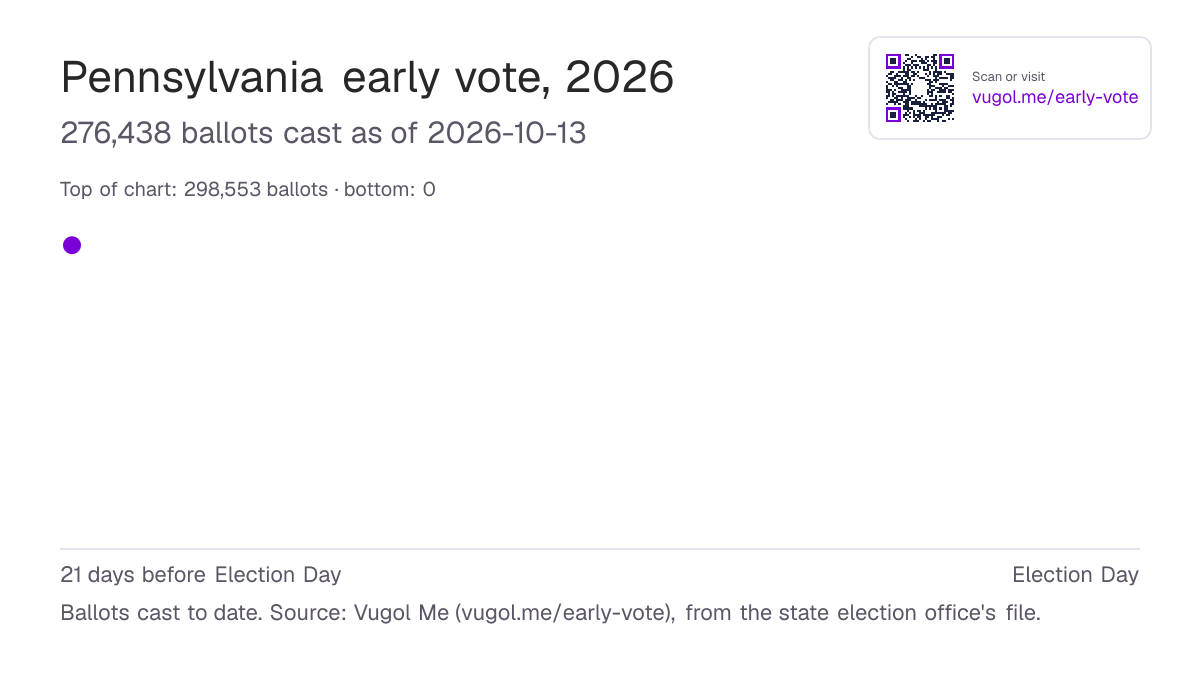
| Mail (civilian absentee) | 276,438 | 100.0% |
|---|
| County | Ballots | Dem | Rep | Other/none |
|---|---|---|---|---|
| Allegheny | 56,626 | 76.3% | 16.5% | 7.2% |
| Philadelphia | 50,303 | 87.0% | 5.8% | 7.2% |
| Montgomery | 49,581 | 71.5% | 19.8% | 8.8% |
| Lancaster | 13,465 | 60.2% | 29.3% | 10.4% |
| Erie | 10,713 | 74.1% | 19.1% | 6.8% |
| Lackawanna | 10,036 | 78.6% | 16.0% | 5.4% |
| Cumberland | 9,484 | 58.6% | 31.4% | 10.0% |
| Beaver | 6,355 | 72.7% | 21.2% | 6.1% |
| Butler | 5,875 | 61.1% | 32.7% | 6.1% |
| Delaware | 5,079 | 71.2% | 20.0% | 8.8% |
| Schuylkill | 4,289 | 57.6% | 35.0% | 7.3% |
| Bucks | 4,153 | 63.6% | 26.3% | 10.1% |
| Monroe | 3,905 | 66.0% | 22.4% | 11.6% |
| Franklin | 3,525 | 53.8% | 36.9% | 9.4% |
| Lycoming | 3,482 | 54.4% | 36.5% | 9.1% |
| Lebanon | 3,456 | 55.4% | 35.0% | 9.6% |
| Crawford | 3,182 | 59.4% | 33.2% | 7.3% |
| Pike | 3,049 | 53.1% | 32.8% | 14.1% |
| Mercer | 2,566 | 66.0% | 26.9% | 7.1% |
| Centre | 2,519 | 68.7% | 20.7% | 10.6% |
| Wayne | 2,518 | 49.6% | 38.8% | 11.6% |
| Chester | 1,985 | 59.7% | 27.4% | 12.8% |
| Clearfield | 1,864 | 60.5% | 33.6% | 5.9% |
| Carbon | 1,737 | 66.3% | 26.5% | 7.3% |
| Washington | 1,584 | 69.6% | 23.9% | 6.5% |
| Northumberland | 1,389 | 62.6% | 30.0% | 7.3% |
| Adams | 1,342 | 55.4% | 34.4% | 10.1% |
| Elk | 1,125 | 60.9% | 33.6% | 5.5% |
| Snyder | 1,068 | 50.3% | 42.1% | 7.6% |
| Clinton | 1,007 | 61.9% | 32.7% | 5.5% |
| Wyoming | 978 | 56.9% | 36.2% | 7.0% |
| Lawrence | 934 | 70.1% | 24.9% | 4.9% |
| Tioga | 886 | 48.2% | 43.9% | 7.9% |
| Columbia | 659 | 64.2% | 27.5% | 8.3% |
| Bradford | 612 | 53.3% | 39.9% | 6.9% |
| Montour | 591 | 58.0% | 32.0% | 10.0% |
| Jefferson | 556 | 52.0% | 38.8% | 9.2% |
| Somerset | 520 | 51.2% | 42.5% | 6.3% |
| Susquehanna | 437 | 59.7% | 35.5% | 4.8% |
| Greene | 363 | 74.4% | 22.0% | 3.6% |
| Mifflin | 342 | 55.8% | 38.9% | 5.3% |
| Northampton | 261 | 55.2% | 30.7% | 14.2% |
| Sullivan | 236 | 53.8% | 39.4% | 6.8% |
| York | 198 | 42.4% | 46.5% | 11.1% |
| Dauphin | 195 | 51.8% | 34.4% | 13.8% |
| Cameron | 175 | 40.0% | 51.4% | 8.6% |
| Westmoreland | 171 | 52.0% | 36.8% | 11.1% |
| Clarion | 136 | 51.5% | 36.0% | 12.5% |
| Berks | 119 | 49.6% | 37.0% | 13.4% |
| Fayette | 108 | 66.7% | 25.0% | 8.3% |
| Forest | 82 | 47.6% | 47.6% | 4.9% |
| Lehigh | 78 | 52.6% | 28.2% | 19.2% |
| Warren | 74 | 36.5% | 54.1% | 9.5% |
| Perry | 66 | 42.4% | 53.0% | 4.5% |
| Potter | 56 | 62.5% | 28.6% | 8.9% |
| Indiana | 52 | 48.1% | 42.3% | 9.6% |
| Juniata | 46 | 34.8% | 39.1% | 26.1% |
| Venango | 46 | 43.5% | 47.8% | 8.7% |
| Union | 45 | 53.3% | 37.8% | 8.9% |
| Armstrong | 42 | 26.2% | 59.5% | 14.3% |
| Luzerne | 34 | 73.5% | 17.6% | 8.8% |
| Mckean | 34 | 55.9% | 41.2% | 2.9% |
| Blair | 25 | 16.0% | 64.0% | 20.0% |
| Bedford | 12 | 25.0% | 75.0% | 0.0% |
| Cambria | 6 | 16.7% | 66.7% | 16.7% |
| Fulton | 1 | 100.0% | 0.0% | 0.0% |
| Huntingdon | 0 | — | — | — |
Download the pace chart (PNG) � free with credit, terms
Source: Pennsylvania election office, official count file, retrieved 2026-10-13 18:03 UTC. SHA-256 59f0ea4dd741a3e6462f8c8deb094667e175b6de37659a256ffa1380109fde2b. Public record; parsed by fixed code. Only totals are kept, never voter-level records.