
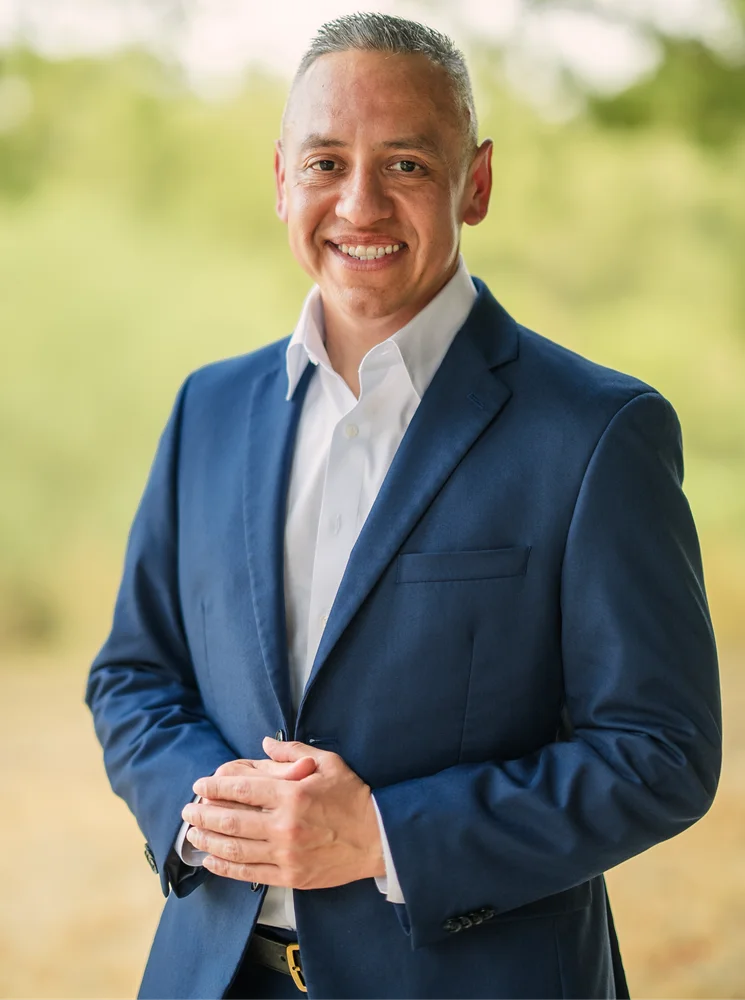
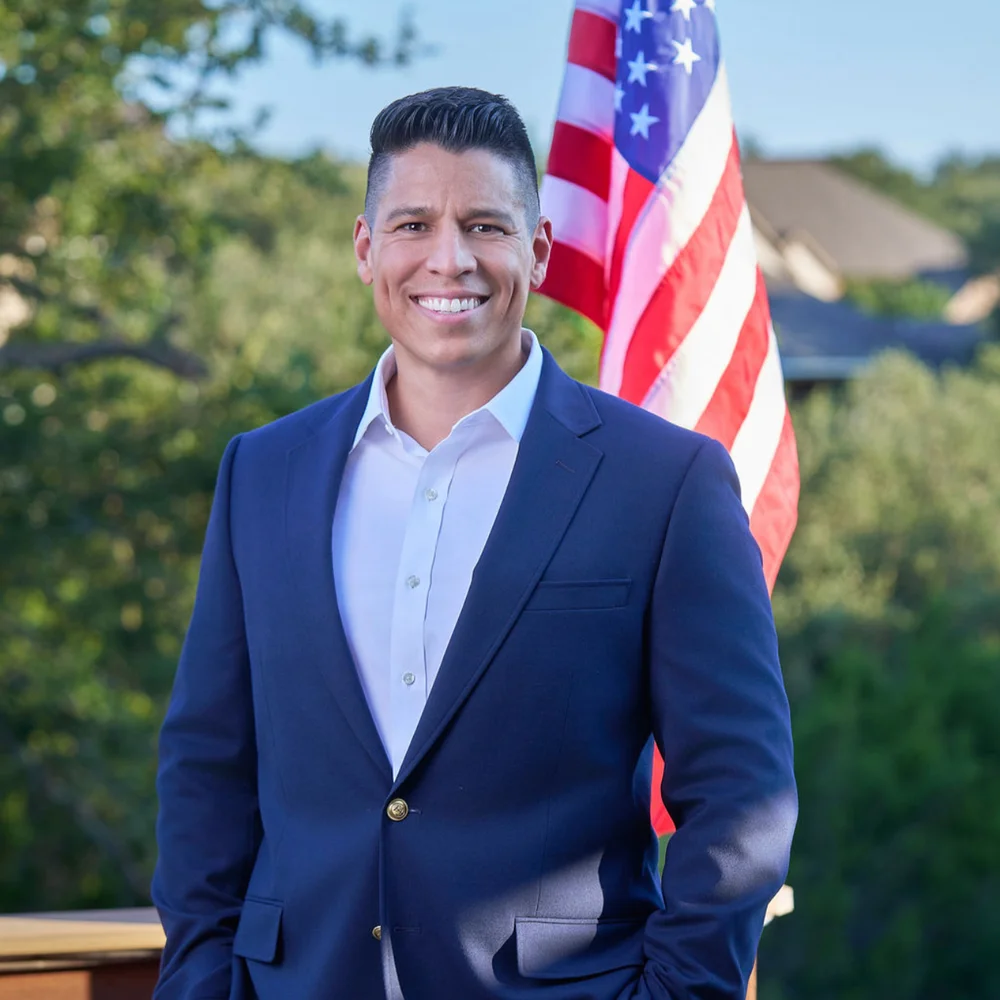




Garcia +2Within margin of error
- Johnny Garcia Democratic: 51%
- Carlos de la Cruz Jr. Republican: 49%
General election · 2 on the certified November ballot · Open seat (no incumbent)
Johnny C. Garcia (D) won this race with 55.4% of the vote, 10.9 points ahead.
Called it: hit Our locked call before polls closed was D; the winner is D. See every locked call
Unofficial until the state certifies the result.
Polls, ratings and the Vugol Tensor below were published before votes were counted. They are not results.
Verified polls Garcia leads de la Cruz by 2.0 points in our average of verified polls.
1 verified poll averaged, newest ended 2026-10-14. Page updated 2026-11-14. Sources · What is validated
ExperimentalNews attention 5/100, how much coverage the race gets, not who is winning. Updated yesterday. How it works
Certified by the state on 2026-08-28, checked 2026-11-13.
Filed or ran for this seat, but not on the state’s certified list for November.
Official source: https://www.sos.texas.gov/elections/forms/2026-ballot-cert.pdf
Verified = published by the pollster that conducted it, with a public source we link to.
How far this poll average can miss · a range, not a prediction
Centre D+2.0. Four times in five the result lands between D+8.7 and R+4.7; nine in ten between D+10.6 and R+6.6. Chance the Democrat finishes ahead: 65%.
Same inputs as the Vugol Tensor page: the verified polling average above (1 verified poll), plus how far polls have missed since 1998. In the backtest the plain poll average picked the wrong winner in about 11% of polled, mostly competitive races (11.2%, 946 races, 1998 to 2024), and polls miss together. Not a forecast guarantee. How Tensor works →
Candidate committee totals for the cycle from the Federal Election Commission (public domain), as of each committee's latest report.
| Candidate | Raised | Spent | Cash on hand | Through |
|---|---|---|---|---|
| Carlos de la Cruz Jr. | $2,021,118 | $1,708,510 | $312,607 | 2026-10-14 |
| Jay Commander Furman | $462,556 | $466,908 | $571 | 2026-09-30 |
| John Lira | $144,967 | $144,967 | $0 | 2026-06-30 |
| John Lujan | $757,513 | $746,326 | $11,187 | 2026-09-30 |
| Johnny Garcia | $2,201,579 | $2,052,076 | $149,503 | 2026-10-14 |
| Joshua Cortez | $265,463 | $265,463 | $0 | 2026-06-30 |
| Maureen Galindo | $40,362 | $28,626 | $15,844 | 2026-06-30 |
| Randal Haskel Adams | $24,493 | $24,493 | $0 | 2026-07-08 |
| Ryan P Krause | $237,646 | $237,646 | $0 | 2026-06-30 |
| Steven William Wright | $25,375 | $43,024 | $0 | 2026-04-15 |
| Vanessa F. Hicks-Callaway | $6,394 | $5,114 | $-4,206 | 2026-04-15 |
| Whitney Masterson-Moyes | $62,724 | $61,368 | $1,356 | 2026-09-30 |
What each campaign reported paying for ads, and what outside groups (super PACs, PACs and parties) reported spending for and against each candidate. Federal Election Commission filings, public domain.
| Candidate | Campaign's own ads | Outside groups for | Outside groups against |
|---|---|---|---|
| Johnny Garcia | $169K | $6.9M | $8.8M |
| Carlos de la Cruz Jr. | $245K | $4.4M | $5.3M |
| Maureen Galindo | $290 | $887K | $699K |
| John Lujan | $37K | $245K | |
| Jay Commander Furman | $164K | ||
| Joshua Cortez | $52K |
Outside groups: 24- and 48-hour independent expenditure reports for the 2026 primary and general, through 2026-10-29, each expenditure counted once after amendments; "ads" is TV, radio, digital and other media, and the rest is mail, phones, canvassing and similar. Campaign's own ads: TV, radio, digital, other media and ad production in the campaign committee's itemized payments, as the campaign described them, from the reports the FEC has processed (latest through 2026-06-30); newer reports appear as the FEC processes them. These are amounts committees reported paying, not airtime tracked by ad-monitoring firms, so very recent buys and future reservations may not show yet. Parser fec-ad-spend-1.0.0.
Vote counts from the state’s own results feed, read every minute while votes are counted. Counts change until the state certifies.
| Johnny C. Garcia | 139,984 | 55.4% |
| Carlos De La Cruz | 112,574 | 44.6% |
Johnny C. Garcia leads by 27,410 votes. 100% of reporting units counted.
| Johnny Garcia won | 13,017 | 63.8% |
| Maureen Galindo | 7,374 | 36.2% |
| Carlos De La Cruz won | 18,927 | 57.6% |
| John Lujan | 13,925 | 42.4% |
| Maureen Galindo advanced | 16,009 | 29.2% |
| Johnny Garcia advanced | 14,836 | 27.0% |
| Whitney Masterson-Moyes | 12,825 | 23.4% |
| John Lira | 11,186 | 20.4% |
| John Lujan advanced | 15,530 | 33.0% |
| Carlos De La Cruz advanced | 12,637 | 26.8% |
| Jay Furman | 6,182 | 13.1% |
| Ryan Krause | 3,986 | 8.5% |
| Josh Cortez | 2,052 | 4.4% |
| Steven Wright | 1,889 | 4.0% |
| Randy Adams | 1,754 | 3.7% |
| Vanessa Hicks-Callaway | 1,676 | 3.6% |
| Mark Eberwine | 752 | 1.6% |
| Rod Lindsch | 365 | 0.8% |
| Larry La Rose | 306 | 0.6% |
Source: the state's official results feed, retrieved 2026-11-14 · parser state-feed-1.0.0
Official federal election dates for this state from the FEC. Registration deadlines and early voting: see the state election office.
Source: FEC election dates (public domain).
Headlines from outlets across the political spectrum, linked to the publisher. Vugol.me doesn’t write or endorse them. How we choose them · All election news
Vugol Me model signals, not polls. Verified polling is in the Polls section above.
Vugol Attention intensity index 0–100 · not a poll · normalized nightly
Proprietary ensemble model · a call, not a probability · model confidence: medium
The breakdown of this call (the model's multi-signal input matrix, input by input) is on Ultra Pro plans.
Per-source daily series, CSV export and the Vugol Vector breakdown · paid plans
Vugol Vector band: D · Anchored. Have a say in the Vugol race poll; it is open to signed-in voters and never feeds these numbers.
They answer different questions and are kept apart. Full method: Methodology.